

Standard Test Conditions (STC) is the laboratory testing standard used to measure and compare solar panel performance. Every wattage rating you see on a solar panel datasheet — “400W,” “430W,” “500W” — refers to power output measured under STC. Understanding STC helps you interpret what panel specifications actually mean in practice, and why real-world output differs from the nameplate rating.
What Are Standard Test Conditions (STC)?
STC defines three specific parameters for measuring solar panel performance:
Irradiance: 1,000 W/m² — The power of sunlight hitting the panel surface. This is approximately the sunlight intensity at solar noon on a clear day at sea level, often called “1 sun.” Cloudy days, haze, and low sun angles all reduce irradiance below 1,000 W/m².
Cell temperature: 25°C (77°F) — The temperature of the silicon cells inside the panel, not the ambient air temperature. 25°C cell temperature is a cool condition — in outdoor operation, cell temperatures routinely reach 45–65°C on warm sunny days. Cell temperature rises because solar panels absorb more sunlight than they convert to electricity, and the excess energy heats the cells.
Air mass: AM 1.5 — A standard solar spectrum representing sunlight after passing through 1.5 atmospheres of air at a 48.2° angle from vertical. AM 1.5 is the reference spectrum defined in IEC 60904-3, representing typical mid-latitude solar conditions. It standardizes spectral content so panels are tested with the same light quality regardless of location or season.
All three STC conditions are defined by IEC 61215 (the international standard for crystalline silicon PV module qualification testing), which is why panels from any manufacturer worldwide can be compared on the same wattage basis.
STC Power Output and What It Tells You
Under STC, a solar panel’s performance is characterized by several measurements from its current-voltage (I-V) curve:
Pmax (Maximum Power): The panel’s rated wattage — the maximum power the panel produces at the optimal operating point on its I-V curve. This is the number marketed as the panel’s capacity (e.g., “400W panel”).
Voc (Open-Circuit Voltage): The voltage across the panel terminals with no current flowing. Used to calculate string voltage for inverter MPPT input range compliance. Voc at STC is the peak voltage the panel ever sees (it’s actually higher in cold weather).
Isc (Short-Circuit Current): The current when the panel’s terminals are shorted together. Used for wire and fuse sizing (× 1.25 safety factor per NEC 690).
Vmp (Maximum Power Point Voltage) and Imp (Maximum Power Point Current): The voltage and current at which the panel produces maximum power. Vmp × Imp = Pmax. These values are used for string design and charge controller sizing.
Fill Factor (FF): Pmax / (Voc × Isc) — a quality metric expressing how “square” the I-V curve is. Higher fill factor (0.78–0.85 for premium panels) indicates lower internal resistance and better build quality.
Why Real-World Output Differs from STC
STC conditions represent a useful reference standard but not a typical real-world operating environment. Here’s how each STC parameter departs from real conditions:
Cell temperature is rarely 25°C during peak production: This is the largest source of STC-to-real-world gap. On a warm summer day (ambient 30°C), cells heat to 50–65°C. Each degree above 25°C reduces output by approximately 0.25–0.50%/°C (depending on the temperature coefficient). At 55°C cell temperature, a −0.35%/°C panel loses (55−25) × 0.35% = 10.5% of STC power from temperature alone.
Irradiance varies throughout the day: 1,000 W/m² only occurs briefly around solar noon on clear days. Morning, evening, and cloudy periods all produce lower irradiance and proportionally lower output. Panels produce some power even at 200 W/m² (overcast days), but well below rated output.
Soiling, shading, and wiring losses: Real systems have dust and pollen on panels (1–5% loss), partial shading from chimneys or trees (variable), wiring resistance (1–3%), and inverter conversion losses (2–4%). These derate actual output from modeled production.
Combined real-world de-rating: Solar designers apply a “performance ratio” (PR) or “system efficiency” factor — typically 0.75–0.85 (75–85%) for a well-designed residential system — to convert STC kW ratings into realistic annual kWh production estimates. PVWatts uses a default DC-AC derate of 86%.
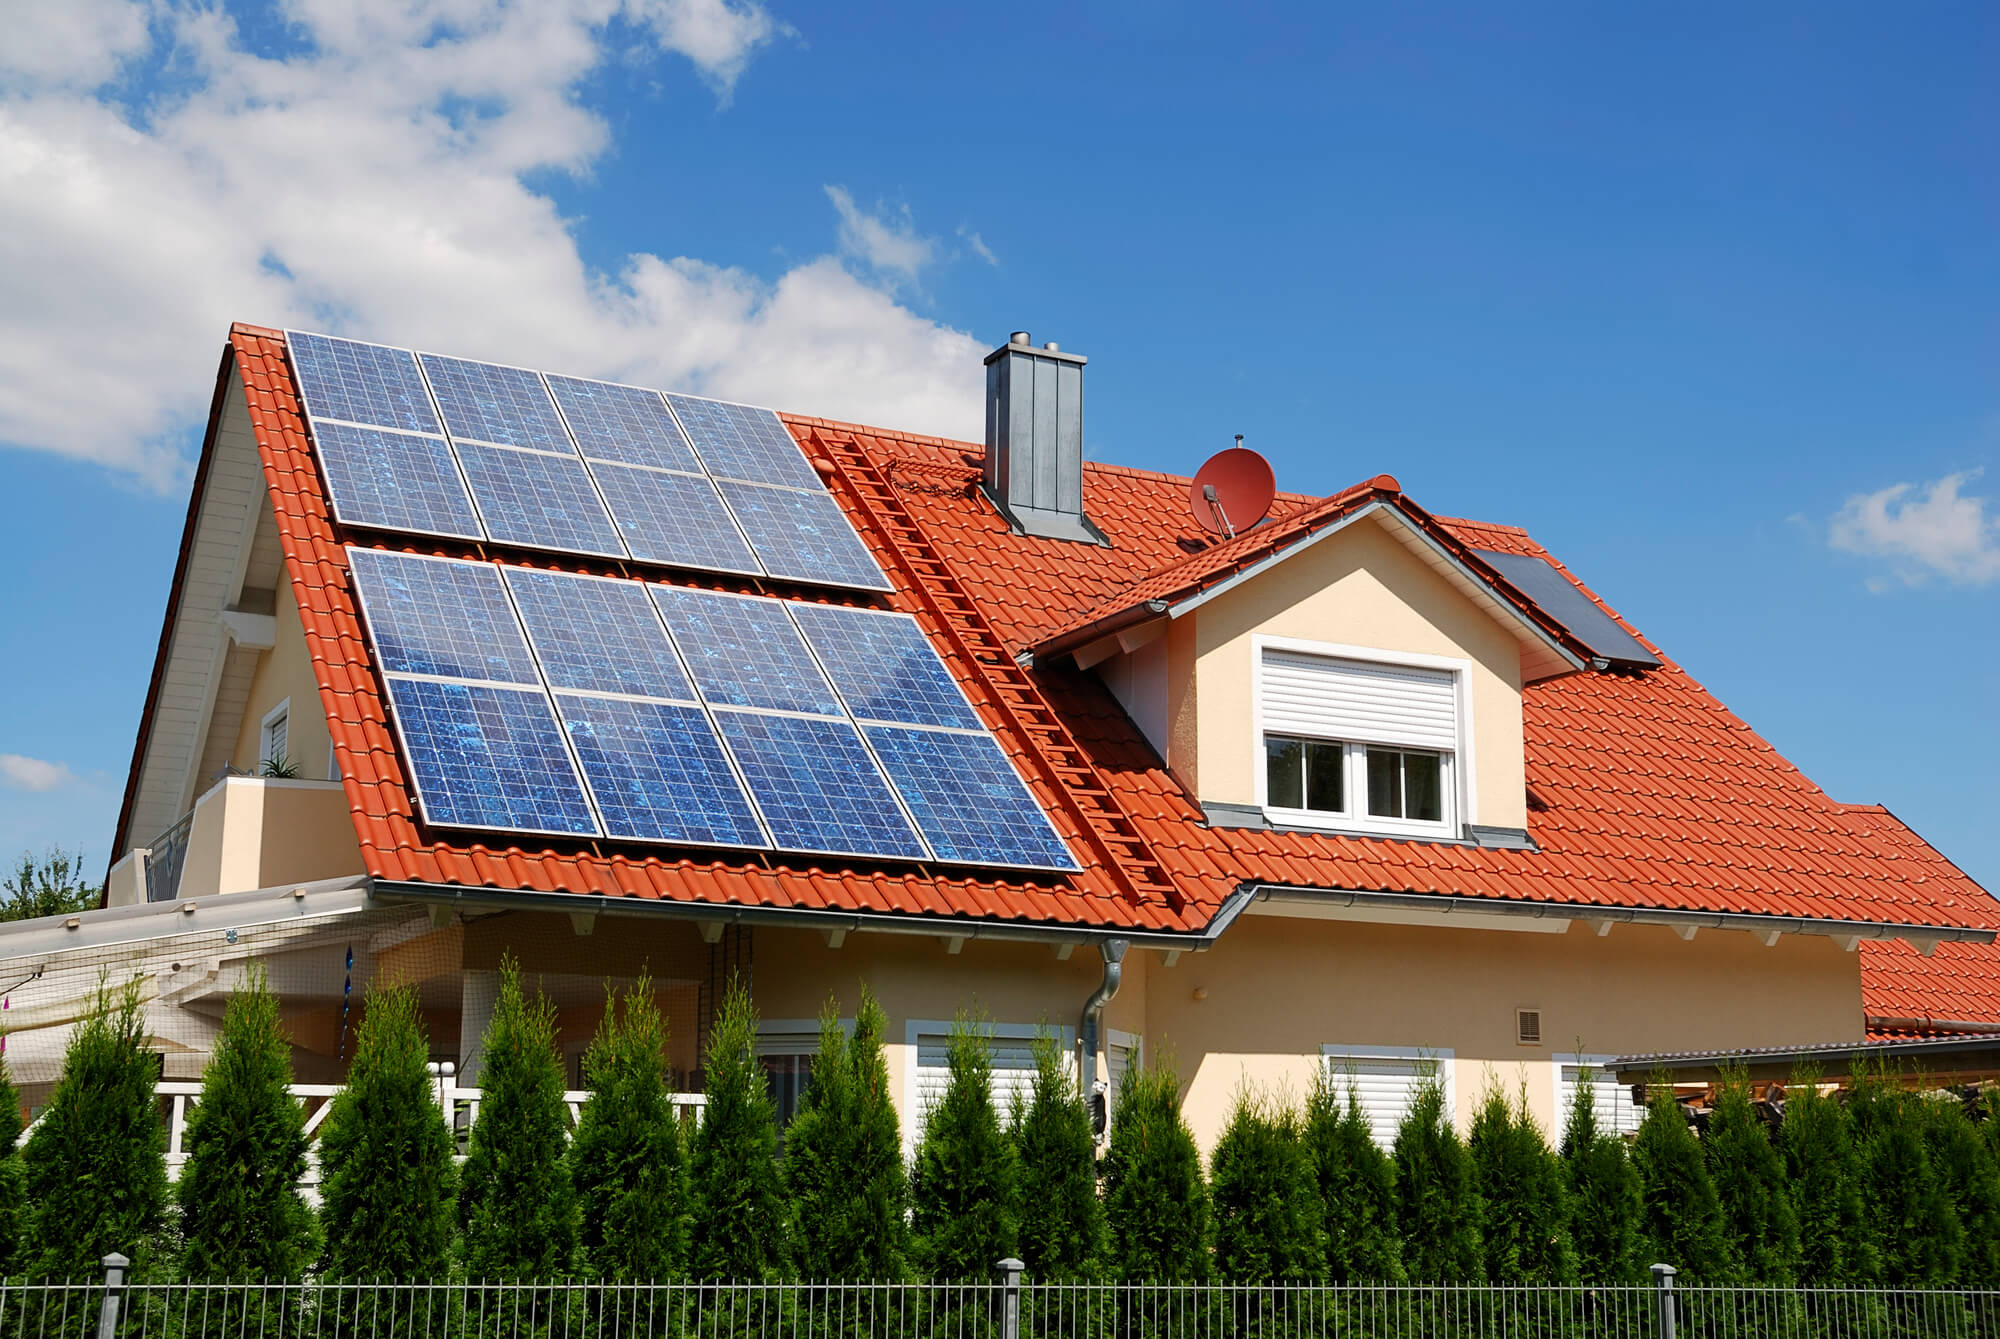
STC vs. NOCT: Two Complementary Reference Points
STC is the primary rating condition for nameplate wattage and panel efficiency. NOCT (Nominal Operating Cell Temperature) is a secondary condition designed to represent more realistic warm-weather operation:
NOCT conditions: 800 W/m² irradiance, 20°C ambient temperature, 1 m/s wind, open-back mounting
Result: cell temperatures typically 43–47°C for most panels
Output at NOCT conditions is typically 7–13% lower than STC-rated wattage due to lower irradiance and higher cell temperature. Some manufacturers report both STC and NOCT power on their datasheets — NOCT power gives a more realistic warm-weather production estimate.
IEC 61853 has introduced NMOT (Nominal Module Operating Temperature) as a refinement of NOCT, using mounted rather than open-back test configuration — more accurately representing a roof-mounted panel’s real thermal environment. Many premium manufacturer datasheets now report NMOT alongside NOCT.
How STC Is Used in Solar System Design
System sizing: System capacity is always quoted in STC kilowatts. A “10 kW solar system” means 10,000W of STC-rated panels (e.g., 25 × 400W panels). This is the standard for permits, interconnection applications, and utility billing.
String sizing: Voc (STC) adjusted for the coldest expected temperature at the site determines maximum string voltage — the cold-temperature Voc increase must not exceed the inverter’s maximum input voltage. STC Vmp × temperature coefficient determines MPPT voltage range at operating temperatures.
Production modeling: PVWatts, Aurora Solar, Helioscope, and PVsyst all start from STC-rated system capacity and apply location-specific irradiance data, temperature corrections, and system losses to generate annual kWh production estimates.
Comparing panels: STC efficiency (Pmax / panel area) is the standard metric for comparing panels of different sizes and technologies. A 420W panel with 2.1 m² area has 20% STC efficiency; a 420W panel with 2.5 m² area has only 16.8% efficiency. Higher efficiency panels require less roof space for the same power output.
Frequently Asked Questions
What does STC stand for in solar panels?
STC stands for Standard Test Conditions — the laboratory measurement standard used to rate solar panel performance. STC specifies three conditions: 1,000 W/m² irradiance (full sun), 25°C cell temperature, and AM 1.5 solar spectrum. Every wattage rating you see on a solar panel or in marketing materials (e.g., “400W panel”) refers to the power output measured at STC. This standardization allows panels from any manufacturer to be compared on an equal basis.
Do solar panels always produce their STC rating?
No — STC is a lab reference condition, not typical outdoor performance. The 25°C cell temperature at STC is cooler than most real-world operating conditions; on warm sunny days, cell temperatures reach 50–65°C, reducing output by 10–15% from STC rating from temperature alone. In practice, a well-designed residential solar system produces about 75–85% of its STC-rated capacity on an annual average basis, after accounting for temperature, irradiance variation, shading, soiling, and inverter losses. This is why energy production estimates in kWh are more useful than panel wattage comparisons.
What is the difference between STC and real-world solar output?
STC assumes 1,000 W/m² irradiance, 25°C cell temperature, and AM 1.5 spectrum — ideal lab conditions. Real-world output is lower for several reasons: cell temperatures typically run 25–40°C above STC reference on sunny days (reducing output by 9–14%); irradiance averages below 1,000 W/m² across all daylight hours; soiling, wiring losses, and inverter efficiency reduce output by another 5–10%. The combined real-world de-rating is typically 15–25% below theoretical STC production — this is accounted for in energy production estimates using performance ratio calculations.
What is AM 1.5 in STC?
AM 1.5 (Air Mass 1.5) defines the solar spectrum used in STC testing. It represents sunlight that has passed through 1.5 atmospheres of air — equivalent to sunlight hitting Earth at a 48.2° angle from vertical. This standardizes the spectral content (the mix of UV, visible, and infrared light) across all panel testing. Different geographic locations, seasons, and times of day all produce slightly different solar spectra. Using AM 1.5 as the standard reference ensures all panels are tested with the same light quality, making wattage ratings comparable worldwide.
How does STC efficiency affect how many panels I need?
STC efficiency is calculated as panel wattage divided by panel area (in m²). Higher efficiency panels produce more watts per square meter of roof space, so you need fewer panels (and less roof area) to achieve the same system capacity. For a 10 kW system: at 20% efficiency (~420W per 2.1 m² panel), you need 24 panels covering about 50 m² (540 sq ft); at 17% efficiency (~360W per 2.1 m² panel), you need 28 panels covering about 59 m² (635 sq ft). If roof space is limited, higher-efficiency panels are worth the premium per watt.
Summing Up
Standard Test Conditions (STC) define the laboratory measurement standard for solar panel wattage ratings: 1,000 W/m² irradiance, 25°C cell temperature, and AM 1.5 spectrum. Every nameplate wattage you see on a panel is measured at STC. Real-world production is typically 75–85% of STC-rated capacity due to higher cell temperatures, lower actual irradiance, and system losses. STC ratings are essential for comparing panels and sizing systems, but energy production estimates (annual kWh) — which account for real-world conditions — are the more meaningful metric for evaluating solar economics. Use STC wattage for panel comparison and system sizing; use production estimates from PVWatts or your installer’s energy model for financial projections.
Updated