
Solar energy has grown from a niche technology into the fastest-growing electricity source in the United States and the world. In 2026, solar generates more electricity annually than any new source added to the US grid, costs less than fossil fuel generation in most markets, and has seen panel prices fall 90%+ since 2010. Here are the most important solar energy facts — covering capacity, cost, physics, environmental impact, and where the technology is heading.
Solar Energy Capacity and Generation Facts
The US has over 239 GW of installed solar capacity as of 2025. The Solar Energy Industries Association (SEIA) reported that the US surpassed 200 GW of total installed solar capacity in 2024 — enough to power approximately 40 million homes. Residential solar alone accounts for approximately 50 GW.
Solar is the fastest-growing source of new electricity in the US. In 2024, solar accounted for approximately 60% of all new electricity generation capacity added to the US grid — more than natural gas, wind, and all other sources combined. This trend continued into 2025.
California generates the most solar in the US by a wide margin. California produces approximately 30% of all US solar electricity despite representing only 12% of the US population. Texas, Florida, North Carolina, and Arizona round out the top five states for solar generation.
Solar provides about 5% of total US electricity generation as of 2025, up from under 1% in 2015. In California, solar provided approximately 25% of all electricity in 2024. Germany, the world’s solar pioneer, regularly achieves 50%+ solar generation on sunny summer days.
A standard residential solar system is 7–10 kW and produces 8,000–14,000 kWh per year depending on location — covering 75–100% of an average US home’s electricity consumption (10,500 kWh/year).
Solar Panel Cost Facts
Solar panel prices have fallen over 90% since 2010. The cost of solar photovoltaic modules dropped from approximately $2.00/watt in 2010 to under $0.20/watt at wholesale scale in 2025. Residential installed system prices (including labor, inverter, racking, and permits) fell from $8–10/watt in 2010 to $2.50–3.50/watt in 2026.
The average US residential solar installation costs $25,000–$35,000 before incentives for a 7–10 kW system, or $17,500–$24,500 after a 30% federal tax credit (where applicable). Actual costs vary significantly by state, installer, and system size.
Utility-scale solar is now the cheapest source of new electricity in most of the US. The levelized cost of energy (LCOE) for new utility-scale solar in the US averaged $33–45/MWh in 2024 — cheaper than natural gas peaker plants ($70–150/MWh) and new nuclear ($120–200/MWh). In high-sun states, utility solar contracts have been signed below $25/MWh.
Solar panel prices in 2026 are approximately $0.20–0.30/watt at residential retail for standard 400W monocrystalline panels, down from $3.00/watt in 2010. The dramatic cost reduction is driven by economies of scale in manufacturing (primarily in China), technology improvements (PERC, TOPCon, HJT cell types), and supply chain optimization.
Solar Physics and Technology Facts
The sun delivers approximately 173,000 terawatts of energy to Earth continuously — about 10,000 times the current global primary energy consumption. The theoretical resource is essentially unlimited; the constraint is how efficiently and economically we can capture it.
Standard commercial solar panels convert 20–24% of sunlight into electricity. Monocrystalline silicon panels (the standard residential technology in 2026) achieve 20–23% efficiency. The highest-efficiency commercial silicon panels (HJT technology) reach 24–25%. Lab record efficiencies using multi-junction concentrator cells exceed 47%, but these are not used in standard commercial installations.
Solar panels degrade at approximately 0.3–0.5% per year for modern TOPCon and HJT panels. A 400W panel installed in 2026 will produce approximately 340–370W in 2051 (25 years) — 85–92% of original output. Manufacturers typically warrant at least 80% of rated output after 25 years.
Solar panels work in cold weather and on cloudy days. Solar panels are more efficient at cooler temperatures (hot panels produce less power). Germany, which is cloudier than many US states, is a world leader in solar deployment. Diffuse light on overcast days still generates meaningful power — typically 20–30% of clear-sky output.
A 400W solar panel is approximately 70 inches × 40 inches (about 1.78m × 1.02m) and weighs 40–50 pounds. A typical residential 8 kW system uses 20 panels and covers approximately 350–400 square feet of roof area.
The photovoltaic effect was discovered by Edmond Becquerel in 1839. The first practical silicon solar cell was demonstrated by Bell Labs scientists in 1954. It achieved 6% efficiency and was immediately applied in space satellites. The first commercially available solar panels for residential use appeared in the 1970s following the oil crisis.
Environmental Facts About Solar Energy
Solar panels pay back the energy used to manufacture them in 1–3 years. The energy payback period (EPBT) for modern monocrystalline panels is approximately 1.0–1.5 years for high-sun locations, rising to 2–3 years for cloudy northern regions. Over a 25-year lifespan, panels generate 8–25 times the energy used to produce them (energy return on investment, EROI).
Solar electricity generates 20–50 grams of CO₂ equivalent per kWh over the full lifecycle (manufacturing, transportation, installation, decommissioning). Natural gas generation produces approximately 490 g CO₂e/kWh; coal approximately 820 g CO₂e/kWh. Solar is 10–25 times less carbon-intensive than fossil fuel generation.
A 7 kW residential solar system prevents approximately 7,000–10,000 kg of CO₂ emissions per year compared to coal-grid electricity — equivalent to planting 300–400 trees or not driving 20,000–25,000 miles.
Solar panels generate no air or water pollution during operation. Unlike combustion-based generation (coal, gas, oil), photovoltaic panels produce zero direct emissions, require no water for cooling, and generate no waste streams during their operational life.
Solar panel recycling is an emerging challenge. The first large wave of panels installed in the 2000s and early 2010s will begin reaching end of life in the 2030s. Regulatory frameworks and recycling infrastructure are developing to handle this. Modern panels use increasingly recyclable materials — aluminum frames, glass, and copper are fully recyclable. Silicon cells require more specialized processing. The EU has mandatory solar panel recycling requirements under WEEE Directive; the US has patchwork state-level programs.
US Solar Incentive and Policy Facts
The federal residential solar tax credit (Section 25D) expired December 31, 2025. The Inflation Reduction Act had extended the 30% residential ITC through 2032, but the One Big Beautiful Bill signed July 4, 2025 ended the Section 25D credit for homeowners who own their systems. As of 2026, homeowners purchasing solar outright no longer receive a federal tax credit.
The commercial/installer solar tax credit (Section 48E) remains active through 2027. Solar installers offering leases and power purchase agreements (PPAs) can still claim the 48E credit — and many pass a portion of that benefit to customers through lower lease rates or PPA pricing. Solar leases and PPAs are still an option for accessing some incentive value.
Most US states offer additional solar incentives beyond the federal credit. State-level incentives include net metering policies (credits for excess solar exported to the grid), solar renewable energy credit (SREC) markets, property tax exemptions for solar installations (available in 36 states), and sales tax exemptions on solar equipment purchases (available in 25 states).
Net metering is available in 41 US states. Net metering credits homeowners for excess solar energy exported to the grid. Credit rates vary — some states offer full retail-rate credits, others (like California under NEM 3.0) offer lower avoided-cost rates averaging 5–8¢/kWh.
Solar Jobs and Economic Facts
The US solar industry employs approximately 270,000 workers as of 2025 (SEIA Solar Jobs Census), making it one of the fastest-growing segments of the energy workforce. Solar employs more people than coal mining and oil and gas pipeline operations combined.
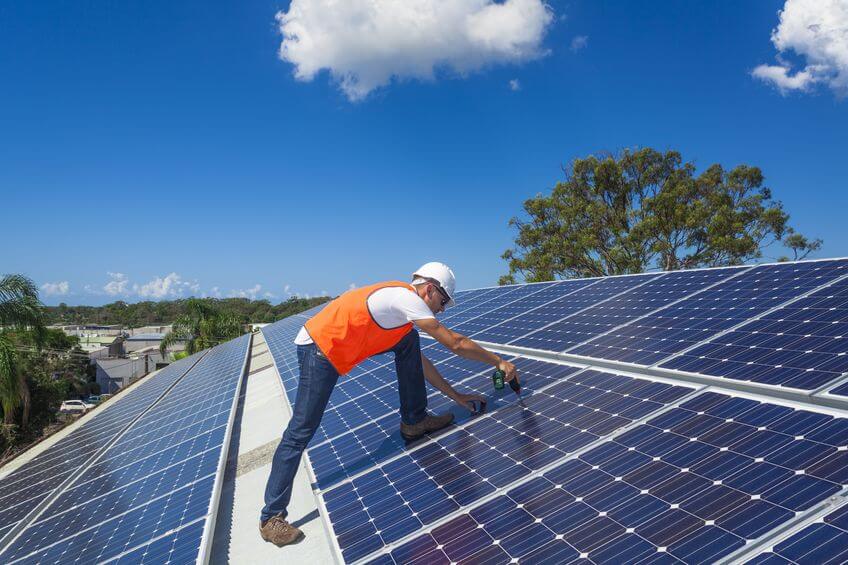
Solar installer is one of the fastest-growing occupations in the US. The Bureau of Labor Statistics projects solar photovoltaic installer employment to grow 52% from 2022 to 2032 — much faster than any other occupation. Median pay for solar installers is approximately $48,000–$58,000 per year.
The US solar industry generates approximately $50 billion in annual economic activity including manufacturing, installation, operations, and supply chain. The Inflation Reduction Act significantly accelerated US domestic solar manufacturing investment — over $40 billion in new US manufacturing facilities was announced between 2022 and 2025.
Global Solar Facts
China is the world’s largest solar market and dominates global panel manufacturing, producing approximately 80–90% of all solar panels used worldwide. China’s installed solar capacity exceeded 600 GW by 2025, more than all other countries combined.
Global solar capacity is approximately 1,500 GW (1.5 TW) as of 2025, having doubled in approximately three years. The International Energy Agency (IEA) projects global solar capacity will exceed 5,000 GW by 2030 under current policy trajectories.
The Bhadla Solar Park in India is the world’s largest solar installation, covering approximately 14,000 acres in Rajasthan with 2.25 GW of capacity. Large solar farms of 1 GW+ are increasingly common in the US, Middle East, and China.
Frequently Asked Questions
How long do solar panels last?
Most solar panels are warranted for 25 years, but they continue functioning well beyond that. Physical panels can last 30–40 years with gradual efficiency decline. The inverter typically needs replacement at 10–15 years, and battery systems (if installed) have 10–15 year battery lifespans before capacity significantly degrades. Many 1990s-era solar panels are still generating meaningful electricity today.
How much does solar save on electricity bills?
A properly sized residential solar system can reduce electricity bills by 50–100% depending on system size, local electricity rates, and net metering policy. The average US solar homeowner saves $1,000–$1,500 per year on electricity bills, with some high-electricity-cost states (California, Hawaii, Massachusetts) seeing savings of $2,000–$3,000+ annually.
What percentage of US electricity comes from solar?
Solar accounted for approximately 5% of total US electricity generation in 2025, up from less than 0.5% in 2012. In leading states like California, solar generates approximately 25% of annual electricity. Nationally, EIA projects solar’s share to reach 10–15% of US electricity generation by 2030.
Are solar panels worth it in 2026?
For most US homeowners, solar panels remain a sound financial investment in 2026 despite the expiration of the Section 25D federal tax credit. With average electricity rates at 18¢/kWh and rising, a solar system’s self-consumed electricity replaces grid electricity at full retail value. Most US markets show payback periods of 8–15 years and 25-year net savings of $20,000–$50,000 depending on system size, location, and electricity rate trajectory.
Which state has the most solar power?
California has the most installed solar capacity of any US state — approximately 45–50 GW as of 2025 — and generates the most solar electricity. Texas is the second-largest solar state by installed capacity, growing rapidly due to large utility-scale projects in West Texas. Florida, North Carolina, and Arizona are also in the top five. Per capita, Hawaii leads all states, with solar on over 30% of single-family homes.
Summing Up
Solar energy is now the cheapest source of new electricity in most US markets, the fastest-growing energy sector by new capacity additions, and a technology with 25+ year hardware lifespans and dramatically declining costs. The US surpassed 239 GW of installed capacity in 2025, solar provides 5% of national electricity generation, and the industry employs 270,000 workers. Environmental facts are equally compelling: solar panels pay back their manufacturing energy in 1–3 years and generate electricity at 10–25 times lower carbon intensity than fossil fuels throughout their operational life.
If you’re ready to put these solar facts to work for your home, call (855) 427-0058 for a free solar assessment. Local installers can calculate your specific savings potential, system size, and payback period at no cost.
Updated