
A solar panel feasibility study assesses whether a solar installation makes technical and financial sense for a specific site before committing to the project. For residential and small commercial projects, most of this assessment happens informally during the installer quote process. For larger commercial and utility-scale projects, a formal feasibility study is a distinct deliverable that drives the investment decision.
What a Solar Feasibility Study Covers
A complete solar feasibility study answers five core questions:
1. Is the site technically suitable? This includes solar resource assessment (peak sun hours by location and season), shading analysis (trees, neighboring buildings, rooftop equipment), roof or land structural capacity, available area for the panel array, and electrical infrastructure compatibility (service panel capacity, interconnection requirements).
2. What system size is optimal? Load analysis compares current and projected electricity consumption with the maximum system size the site can support. The study determines whether the goal is 100% offset, partial offset, or export to the grid — and what system size achieves each scenario.
3. What will it produce? Production modeling uses location-specific solar irradiance data (typically from NREL’s National Solar Radiation Database or NASA’s POWER database), system specifications, and shading factors to estimate annual kWh production. Tools commonly used include PVWatts, Helioscope, Aurora Solar, and PVsyst.
4. What does it cost and what’s the return? Financial analysis covers installed system cost, financing options, monthly savings, simple payback period, IRR (internal rate of return), NPV (net present value), and 25-year cash flow projections. Incentive analysis identifies applicable utility rebates, state credits, and federal programs — in 2026, Section 25D (residential homeowner credit) has expired, but Section 48E applies to commercial systems and installations using leases or PPAs through 2027.
5. What are the interconnection and regulatory requirements? This covers utility interconnection process and timeline, net metering availability and rate structure, permit requirements, and any HOA or historical preservation restrictions.
Residential Feasibility: What Installers Assess During Quoting
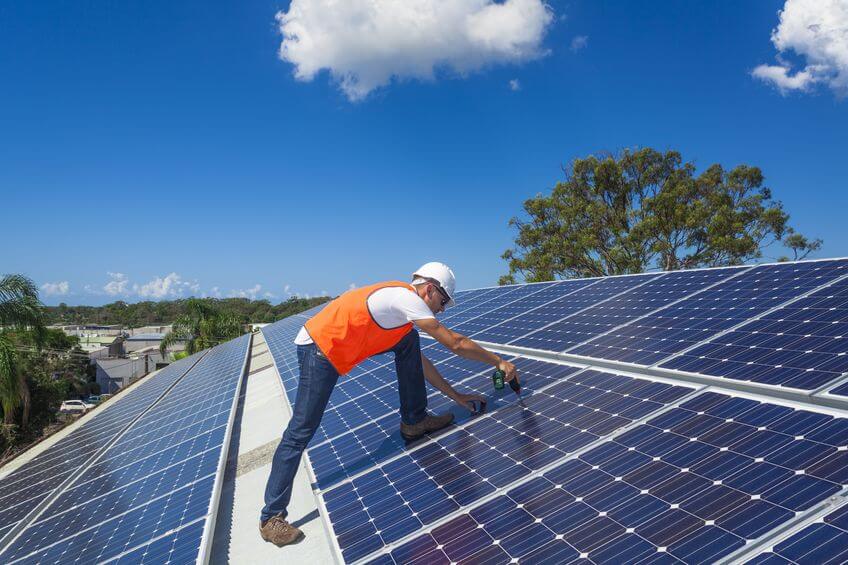
For residential projects, most homeowners don’t commission a separate feasibility study — the installer’s site assessment and proposal serves this function. A thorough residential site assessment includes:
Roof assessment: Age, condition, and remaining useful life (systems are designed for 25–30 years, so the roof should have at least 10+ years of life remaining to avoid reinstallation costs). Roof material compatibility with mounting hardware. Structural capacity for panel weight (typically 4–6 lb/ft² including racking). Orientation and tilt angle of each roof plane.
Shade analysis: Installers use tools like SunEye, Solargraf, or Aurora Solar’s satellite-based shading analysis to assess obstructions throughout the year (sun is lower in winter and shade patterns change significantly by season). Shading of even one panel can significantly reduce string inverter output — this analysis determines whether microinverters or power optimizers are warranted.
Electrical assessment: Service panel capacity (200A panels typically accommodate solar; 100A panels may require upgrades), existing branch circuits, and grounding system. The inspector verifies that a solar system can be interconnected under NEC 690 requirements.
Production estimate: PVWatts is standard for residential estimates — it uses NREL’s TMY (typical meteorological year) data for the location, panel tilt and azimuth, system wattage, and system losses to produce an annual kWh estimate. The estimate should show monthly production variation so homeowners understand seasonal performance.
Quality residential quotes include a system design layout (aerial view showing panel placement), a 25-year production estimate, and an itemized financial analysis. If a quote doesn’t include these elements, it’s a red flag about the installer’s thoroughness.
Commercial Feasibility Studies
Commercial projects — rooftop systems over 50 kW, parking canopies, ground mounts, community solar — typically warrant a formal feasibility study as a stand-alone document before the project proceeds to engineering and procurement.
Energy audit integration: Commercial feasibility studies often begin with a load analysis that reviews 12–24 months of utility billing, identifies demand charge patterns (important for sizing), and determines whether energy efficiency improvements should be made before solar to right-size the system.
Multiple scenario modeling: Rather than a single system size, commercial studies typically present 2–4 scenarios: 100% kWh offset, optimal financial return (which may not be 100% offset if utility interconnection caps net export), and maximum site coverage. Financial metrics for each scenario allow the owner to choose the system that aligns with their financial goals.
Interconnection pre-assessment: Larger systems (typically above 500 kW) require a formal utility interconnection study, which can take 6–24 months. Commercial feasibility studies assess interconnection feasibility early to identify potential showstoppers before significant project costs are incurred.
Structural report: Commercial roof-mounted systems require a structural engineer’s report confirming the building can support additional dead loads from the array, particularly for older industrial buildings.
Key Financial Metrics in a Feasibility Study
Simple payback period: Total installed cost ÷ Annual savings. The most intuitive metric. For commercial systems in 2026 (without the 25D homeowner credit), commercial systems using Section 48E through 2027 for the installer’s tax position can pass savings through PPAs and leases, but owned commercial systems use MACRS 5-year depreciation. Residential owned systems no longer benefit from Section 25D and have simple payback periods of 10–16 years in most markets.
IRR (Internal Rate of Return): The annualized return on the solar investment over the system’s lifetime (typically 25 years). A 6–12% IRR is typical for residential systems in 2026 (without federal ITC); commercial systems with MACRS depreciation often achieve 8–14% IRR. Compares directly to alternative investments — a 10% IRR on solar outperforms the average annual return of a savings account or bond.
NPV (Net Present Value): The present value of all future cash flows minus the initial investment, discounted at the opportunity cost of capital (typically 5–8% for residential analysis). Positive NPV means the investment creates value.
Levelized Cost of Energy (LCOE): Total lifetime cost of the system divided by total lifetime production (in kWh). Expresses the cost of solar-generated electricity in $/kWh, which can be compared directly against the utility rate. Residential solar typically achieves LCOE of $0.06–$0.12/kWh in 2026, well below average US retail rates of $0.16–$0.22/kWh.
When to Commission a Formal Feasibility Study
A formal stand-alone feasibility study (rather than an installer’s quote) is warranted when:
— The project is large enough that a dedicated professional’s independent analysis adds value (typically commercial systems above 100 kW or projects over $500K)
— The decision-maker wants an independent second opinion before committing to a large expenditure
— The site has unusual characteristics (complex shading, aging roof requiring replacement, unusual utility tariff structure) that require specialist analysis
— Financing or permitting requires an independent professional report
— A municipality, school district, or public agency requires a third-party study before approving capital expenditure
For residential projects, a formal feasibility study is almost never necessary — the installer’s detailed proposal, backed by PVWatts production modeling and verified by requesting quotes from 3+ installers, provides equivalent information.
Solar Feasibility Tools and Software
PVWatts Calculator (NREL — free): The US standard for production modeling. Available at pvwatts.nrel.gov. Enter location, system size, tilt, azimuth, and module type — outputs monthly and annual production estimates. Widely used for residential proposals and referenced by utilities in interconnection applications.
Aurora Solar: Professional installer software with satellite-based shading analysis, 3D roof modeling, production simulation, and financial analysis. Produces the detailed shade analysis reports that quality residential installers include in proposals.
Helioscope: Used by commercial solar engineers for detailed system layout, shading simulation, and production modeling. More advanced simulation capabilities than PVWatts for complex commercial projects.
PVsyst: Industry-standard simulation software for utility-scale and complex commercial projects. Produces bankable production estimates that meet investor and lender requirements for project financing.
Google Project Sunroof: Free consumer tool showing estimated solar potential for residential addresses. Less accurate than professional tools but useful for initial screening before engaging installers.
Frequently Asked Questions
How much does a solar feasibility study cost?
Residential: effectively free — the installer’s site assessment and proposal covers this analysis at no charge. Commercial and industrial: $3,000–$25,000+ depending on system size, project complexity, and the depth of study required. A basic feasibility report for a 200 kW commercial rooftop system typically costs $5,000–$10,000 from an independent solar consultant. Larger utility-scale feasibility studies (1 MW+) can cost $25,000–$100,000+, but represent a small fraction (0.5–2%) of the project cost.
What is included in a solar feasibility report?
A complete solar feasibility report includes: executive summary with go/no-go recommendation, site assessment (solar resource, shading, structural, electrical), system sizing scenarios, production estimates with monthly breakdown, financial analysis (simple payback, IRR, NPV, LCOE), incentive analysis, interconnection assessment, and permitting requirements. For commercial projects, it also covers roof structural analysis, environmental review (if required), and alternative siting options.
How accurate are solar production estimates?
Professional production estimates using PVWatts or Helioscope are typically within ±10% of actual first-year production for standard residential and commercial installations. Key sources of variance: actual weather versus TMY averages (TMY years represent typical conditions, but actual years vary), installation quality (soiling, wiring losses), and shading assessment accuracy. Over a 10-year period, actual production typically averages within 5% of the modeled estimate as year-to-year weather variation averages out.
Can I do my own solar feasibility assessment?
For a residential property, yes — with tools like PVWatts and Google Sunroof, a homeowner can generate a reasonable first estimate. Enter your address in PVWatts, set the system size to 8 kW (a typical residential system), and compare the annual kWh output to your utility bill. Divide your annual electricity cost by the system’s estimated annual production to estimate savings. This won’t account for shading, roof limitations, or local utility rates with the precision of a professional assessment, but it provides a reasonable sanity check before engaging installers.
Do I need a feasibility study before getting solar quotes?
For residential projects, no — get quotes directly from 3+ NABCEP-certified installers. Their proposals will include the production estimates and financial analysis you need. For commercial projects above 100 kW or with unusual site characteristics, a feasibility study before soliciting bids helps you evaluate proposals against an independent baseline and avoid being misled by optimistic production estimates. To speak with a solar installer about your specific project, call (855) 427-0058 for a free consultation.
Summing Up
A solar feasibility study evaluates whether a solar installation makes technical and financial sense for a specific site, covering solar resource, shading, system sizing, production estimates, and financial returns. For residential projects, the installer’s proposal serves this function — the key is getting multiple detailed quotes from qualified installers that include production modeling and 25-year financial projections. For commercial projects above 100 kW, an independent feasibility study from a solar consultant provides the analysis depth needed to support investment decisions, financing, and permitting. Key financial metrics to evaluate: simple payback period, IRR, NPV, and LCOE against the local utility rate.
Updated